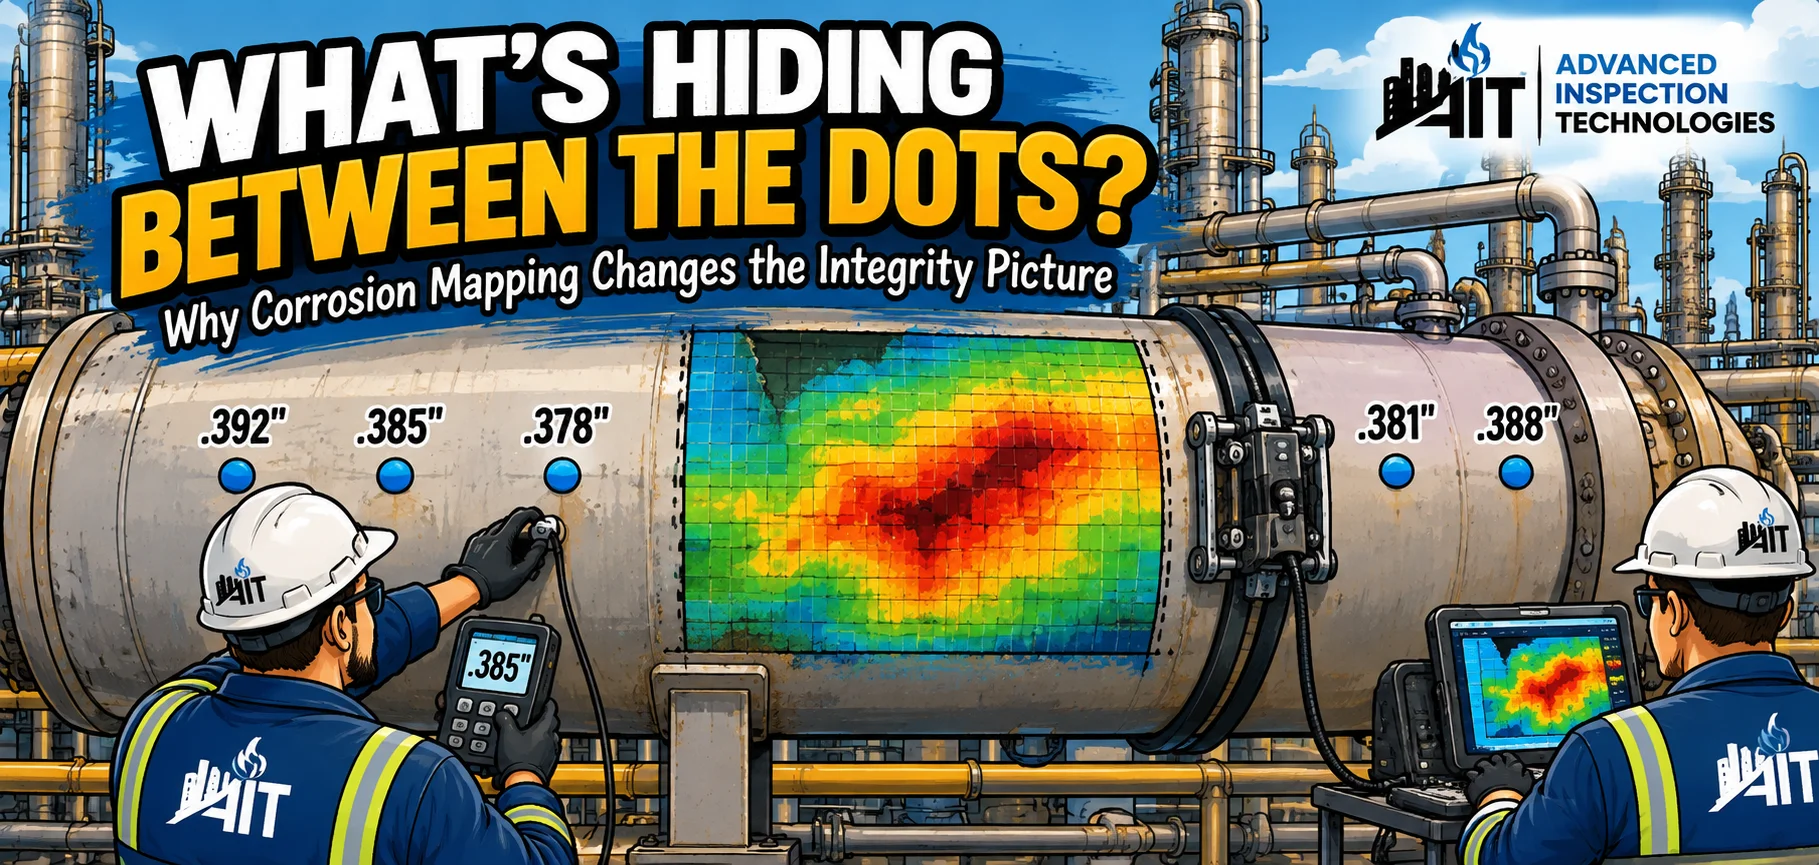
The scaffold wraps the lower shell of a drum still warm from the last campaign. Paint is mottled. A few CMLs (condition monitoring locations) from the last turnaround sit marked in chalk — dots on the shell, useful bookmarks, not a map. Integrity wants to know whether the thinning under this course is a local pit field, a broad band of general loss, or something that only shows up between the old grid points. Spot ultrasonic thickness (UT) only reads the dots. Encoded corrosion mapping shows what is hiding between them.
That is the job of a C-scan corrosion map: thousands of wall-thickness readings, each tied to a position on the vessel, pipe, or tank shell, rendered as a plan-view color image so the worst wall, the shape of the damage, and the coverage actually achieved are visible in one place.
What the inspector is really building
Corrosion mapping is still pulse-echo ultrasonics. Sound goes in, the back-wall echo comes back, and time of flight becomes remaining wall. The step that changes the integrity conversation is encoding. An automated UT (AUT) scanner raster-scans the defined area while encoders record exactly where every reading was taken.
The difference shows up in the numbers. A standard 3/4" diameter UT probe on a CML band gives you about 4 readings across 2" of surface. AUT collecting on a 0.1" x 0.1" grid gives you 100 readings in every square inch, with 100% coverage around the area of interest.
Each of those readings becomes a pixel on the map. Full wall paints one end of the color scale, and thinning moves through amber into the bands the procedure defines as attention and action. When the scan is clean, morphology shows up before anyone opens a spreadsheet: isolated pits a sparse grid would miss, longitudinal grooving from flow-assisted attack, or a broad pancake of general loss under a former insulation band.
What matters is coverage, coupling, and a scan plan that matches what integrity actually needs to decide.
What separates a useful map from a folder filler
A pretty C-scan is easy. Actable data is harder. Integrity and reliability engineers are not collecting wallpaper for the turnaround closeout. They need inputs that survive an audit and feed remaining-life, Fitness-For-Service (FFS), and repair decisions.
On a good scope, that usually means:
- Traceable grid and datums — the map is referenced to nozzles, weld seams, course numbers, or spool IDs so next outage can reoccupy the same area
- Documented coverage — what was scanned, what was blocked by supports or attachments, and where judgment filled a gap
- Thickness statistics that match the decision — minimum remaining wall, location of the minimum, and enough distribution to tell pit vs. general loss
- Clear comparison to nominal and retirement thickness — not just colors, but numbers the API 510 / API 570 / API 653 inspector can put against the vessel or piping record
- A file that can be reopened — encoded data, not only a screenshot, so the next campaign can subtract and talk corrosion rate by location
Where conventional spot UT would hand you one anxious number per CML, a mapped zone hands you the true minimum in that patch and the pattern that explains how it got there. That pattern is often half the engineering call: a tight pit field drives a different FFS path than smooth general thinning over a wide footprint.
Surface reality still wins. Rough, scabbed, or poorly prepared OD kills coupling. High temperature needs technique and hardware that match the metal, not a cold-steel procedure forced onto a hot shell. Complex geometry — knuckle regions, nozzle belts, tight pipe racks — needs a scan plan, not hope that the scanner will figure it out. The call in the field is whether the data in hand is honest enough to close the zone or whether a follow-up pass, a different probe footprint, or a local prove-up is still required.
How the map feeds the integrity program
Encoded corrosion mapping sits inside the mechanical integrity loop, not beside it.
For pressure vessels under API 510, shell and head mapping around known damage mechanisms or suspect bands turns "we took some thicknesses" into area characterization for on-stream inspection and next-interval planning. For piping under API 570, mapped spool sections or soil-to-air and former CUI windows show whether wall loss is random pitting or a mechanism with a preferred direction. On aboveground storage tank shells supporting an API 653 program, course mapping gives the shell assessment a defensible minimum and extent instead of interpolating between a handful of verticals.
Risk-based inspection thinking under API 580 / API 581 cares about the same thing in different language: probability and consequence sharpen when you know the damage morphology and the worst remaining wall, not when you hope the CML grid caught the pit. When remaining life or FFS work starts — including assessments that lean on API 579 / ASME FFS-1 principles — the map's job is to supply location-referenced minima, extent, and (on repeat scans) local rates. The engineering calculation is only as honest as the thickness field underneath it.
At Advanced Inspection Technologies (AIT), corrosion mapping on vessels, piping, and tank shells is treated as integrity data production. The crew's job is not to chase the brightest color on the screen. It is to leave the owner with coverage they can defend, minima they can trust, and a dataset that still means something when the next outage opens the same file.
The takeaway
A corrosion map earns its place when an integrity engineer can act on it — schedule a repair, justify an interval, run an FFS case, or close a concern with documented coverage — without guessing what was hiding between the dots (the old CML points). Encoding, coverage, morphology, and reporting that speak the language of remaining wall and remaining life are what separate that deliverable from a color picture that never leaves the folder.
If your next vessel, piping circuit, or tank shell needs mapping that feeds the integrity call rather than decorates the closeout package, AIT is glad to talk through scan plan, coverage, and reporting that fit your program. Reach the team at www.advinsptech.com, (832) 861-6358, or info@advinsptech.com — or look for more field-focused pieces on the AIT Resources page.